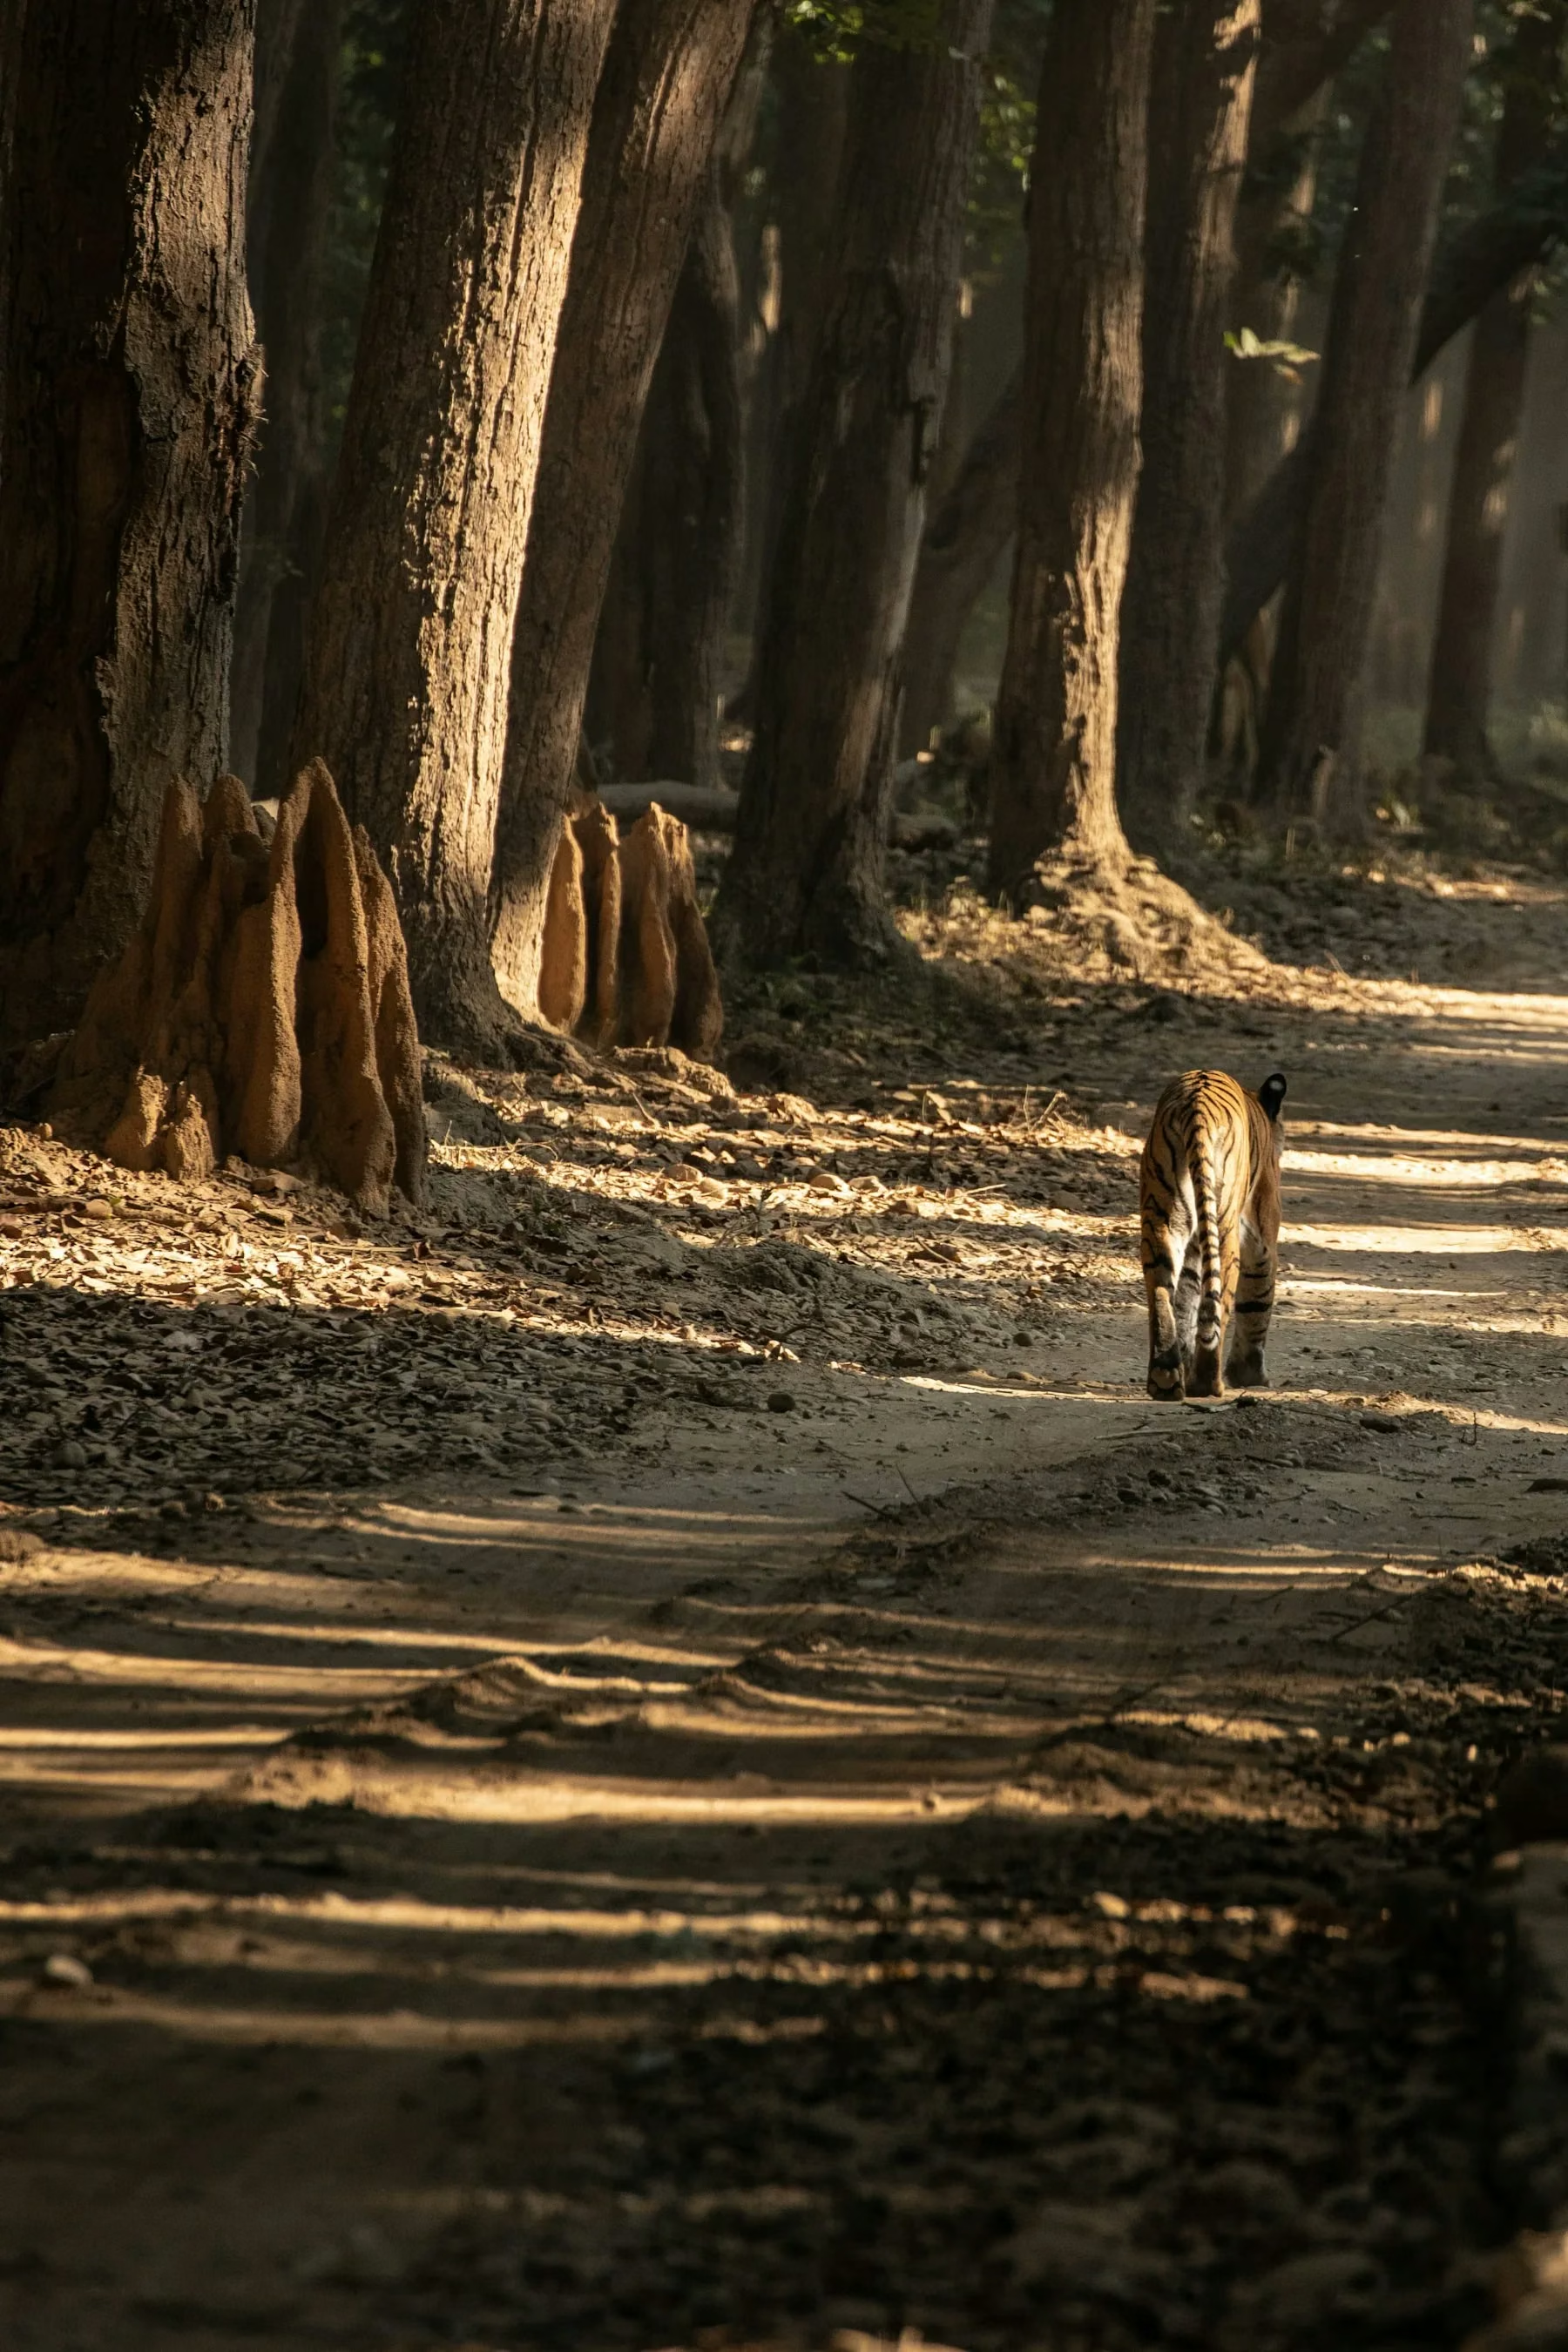
Ask how many tigers live in Rajaji and the answer arrives with a year attached to it, or with no year at all. The official record does carry numbers for this reserve, but they are not all the same kind of number: two survey-cycle estimates for the reserve as a whole, one density figure, one regional profile that reads zero, and one programme row that reads five. This page sets each figure out with its table, document and date, and keeps them apart. None of them is a count of the tigers standing in the forest on the day you read this.
Sources checked on 4 November 2026: the National Tiger Conservation Authority and the Wildlife Institute of India's Roadmap for Active Management of Tigers in India (June 2026) and their Reintroduction and Population Recovery of Tigers in India: Field Learnings and Case Studies (June 2026); and this site's own published pages, linked at the foot of this article.
What Table 1 of the roadmap prints
Table 1 of the June 2026 roadmap carries three figures for Rajaji, and they belong together on one row of one table. The first is 13 tigers for AITE 2014. The second is 54 tigers for AITE 2022, given for Rajaji as a whole — the eastern and western parts of the reserve together. The third is a 2022 density of 8.15 tigers per 100 sq km. AITE is the All India Tiger Estimation, the national survey cycle that produces these labels, and every figure in that row is stamped with the cycle it came from rather than with a calendar day of observation.
Read the row literally and it says this: the 2014 cycle produced an estimate of 13 for the reserve, the 2022 cycle produced an estimate of 54 for the reserve, and the 2022 cycle produced a density estimate of 8.15 per 100 sq km. Nothing in the table converts those figures into a number of animals anyone has counted one by one, and nothing in the table is dated to a day in 2026.
An estimate is not a count
The distinction matters more than any single number on this page. An All India Tiger Estimation figure is a survey-cycle estimate: it is produced by a national method run on a cycle, it is labelled with the year of that cycle, and it is revised when the next cycle runs. A count, by contrast, is a tally of animals enumerated — a thing this reserve does not publish for tigers, and a thing no document used here claims.
That is why 54 is the 2022 estimate and not a figure for today. The correct sentence is "the 2022 cycle estimated 54 tigers for Rajaji as a whole". The incorrect sentence is "Rajaji has 54 tigers", which drops the cycle label and turns a dated statistical result into a present-tense inventory.
The mechanics behind those estimates — the phased foot surveys, the camera trapping, the individual identification work and the model-based abundance estimation — are set out on this site in the research and monitoring article, which also explains why a density figure is not a headcount. That article carries the detailed method discussion and the sampling figures; this page links it rather than re-arguing any of it.
Why 13 and 54 are not a trend
It is tempting to place 13 next to 54, subtract one from the other and announce growth. This page does not do that, and the reason is not caution for its own sake: the two rows are two separate survey cycles, and method and coverage can change between cycles. A cycle that surveys more ground, places cameras differently or models abundance differently will move its estimate for reasons that have nothing to do with the number of tigers alive.
So the pair of figures is best read as a pair of dated official estimates, not as a slope. No percentage is calculated here, no annual rate is offered, and no claim is made that the population rose, fell or held steady between 2014 and 2022. Anyone who wants to know what changed between the cycles should start with how the cycles are run, which is the subject of the research and monitoring article.
The same document's western profile reads zero
The roadmap does not stop at the whole-reserve row. Its profile for Rajaji Tiger Reserve, Uttarakhand (Western Part) gives a Tiger Population (AITE, 2022) of 0, together with a status of Tiger down, Prey up, Habitat down. That zero sits in the same June 2026 document as the 54, and readers who find both quickly assume one of them must be wrong.
Neither is wrong, because they are not answers to the same question. The 54 is the whole reserve, eastern and western parts counted together on the AITE 2022 cycle. The 0 is the western part alone on that same cycle, printed in a regional profile with its own status line. A reserve total and a regional profile row measure different scopes, so the two figures are not rivals and cannot be netted against each other to produce a third number.
The reintroduction table in the second June 2026 document prints a different figure again for the west, and the question of how those two documents sit beside each other is worked through in the western supplementation article. That page holds the table-by-table comparison; this one links it and leaves the detailed argument there.
The 2020 row: five animals, not a census
The reintroduction table of the second June 2026 document has one row for this reserve. Its Year is 2020. Its Before figure is 0, its Initially Introduced figure is 5 (2M, 3F) — two males and three females sourced from the Corbett landscape — and its Present Population figure is 5.
Every word in that row belongs to a programme rather than to a census. The row counts animals handled as part of one supplementation and augmentation effort, totalled across the life of that effort; it is not a survey of the field on a stated date, and the "Present Population" column is a programme column, not a headcount published for the western part today. The document does not give release dates for the five animals, so this page attaches none, and it does not treat the row as evidence about survival, breeding or current occupancy. A tally of animals moved and an estimate produced by a survey cycle answer different questions, and neither answers "how many tigers are in Rajaji now".
What this page will not claim
Five abstentions, listed so that silence is not read as an oversight. No current tiger total is given for Rajaji: the last published national estimate in the sources located for this page is AITE 2022, and no later figure was found as of 4 November 2026. No figure for any other estimation cycle is reproduced, because none was verified for this page. Neither June 2026 table is called a census — one prints survey-cycle estimates and status ratings, the other prints programme records. No trend is inferred between the 13 of 2014 and the 54 of 2022. And the zero and the five are never combined into a net figure for the west, because a profile row and a programme row are not the same measurement.
Where to read next
For how these estimates are produced and why a density is not a headcount, the research and monitoring article. For the two June 2026 documents read side by side, the western supplementation article. For the 1995 Zoological Survey of India inventory of the park's mammals, the mammal record, and for the same volume's bird inventory, the bird record. Sources checked 4 November 2026.
Rajaji's 2022 tiger estimate: questions answered
How many tigers does the 2022 estimate give for Rajaji?
54 for the reserve as a whole. Table 1 of the June 2026 roadmap prints 13 tigers for AITE 2014, 54 for AITE 2022 and a 2022 density of 8.15 per 100 sq km for Rajaji as a whole, covering the eastern and western parts together: https://ntca.gov.in/wp-content/uploads/2026/06/Road-Map-Active-Management-of-Tigers_Final_June-2026.pdf. Those are survey-cycle estimates printed in a table, not a headcount taken on a stated day.
Is 54 the number of tigers in Rajaji today?
No, and this page never says so. The All India Tiger Estimation is a survey cycle: an estimate produced by a repeatable national method and labelled with the year of the cycle. The 54 is the figure attached to the 2022 cycle, which is the last published national estimate in the sources located for this page as of 4 November 2026. This page claims no current total for the park and no total for any later cycle.
Why does the same roadmap give 0 for western Rajaji?
Because the two rows measure different scopes on the same cycle. The whole-reserve row gives 54 for AITE 2022, while the document's profile for the western part gives a Tiger Population (AITE, 2022) of 0 with a status of Tiger down, Prey up, Habitat down. One is the reserve, the other is a region inside it, so they are not rival counts of the same thing. The full side-by-side reading of that profile against the reintroduction table belongs to the western supplementation article on this site, which is not re-argued here.
What does the 2020 reintroduction row mean?
It is a programme tally. The reintroduction table gives Year 2020, a Before figure of 0, an Initially Introduced figure of 5 (2M, 3F) and a Present Population figure of 5, with Corbett Tiger Reserve as the source site: https://ntca.gov.in/wp-content/uploads/2026/06/Tiger-Reintroduction-Field-Learnings-Case-Studies-Final-June.pdf. Those are animals handled as part of one supplementation programme and totalled across that programme, not a census taken on a date, not a current count of the west, and not a figure for the reserve as a whole. The document does not date the releases, and this page does not supply dates for them.
Can the 13 of 2014 and the 54 of 2022 be read as a trend?
Not on this page. The two rows come from two separate survey cycles whose method and coverage can differ between cycles, so the pair is a question about how estimates are produced before it is a question about animals. How the national method builds these numbers — foot survey phases, camera trapping and model-based abundance estimation — is set out in the research and monitoring article on this site, which this page links rather than repeats. No trend, no rate and no percentage is drawn here. Sources checked 4 November 2026.