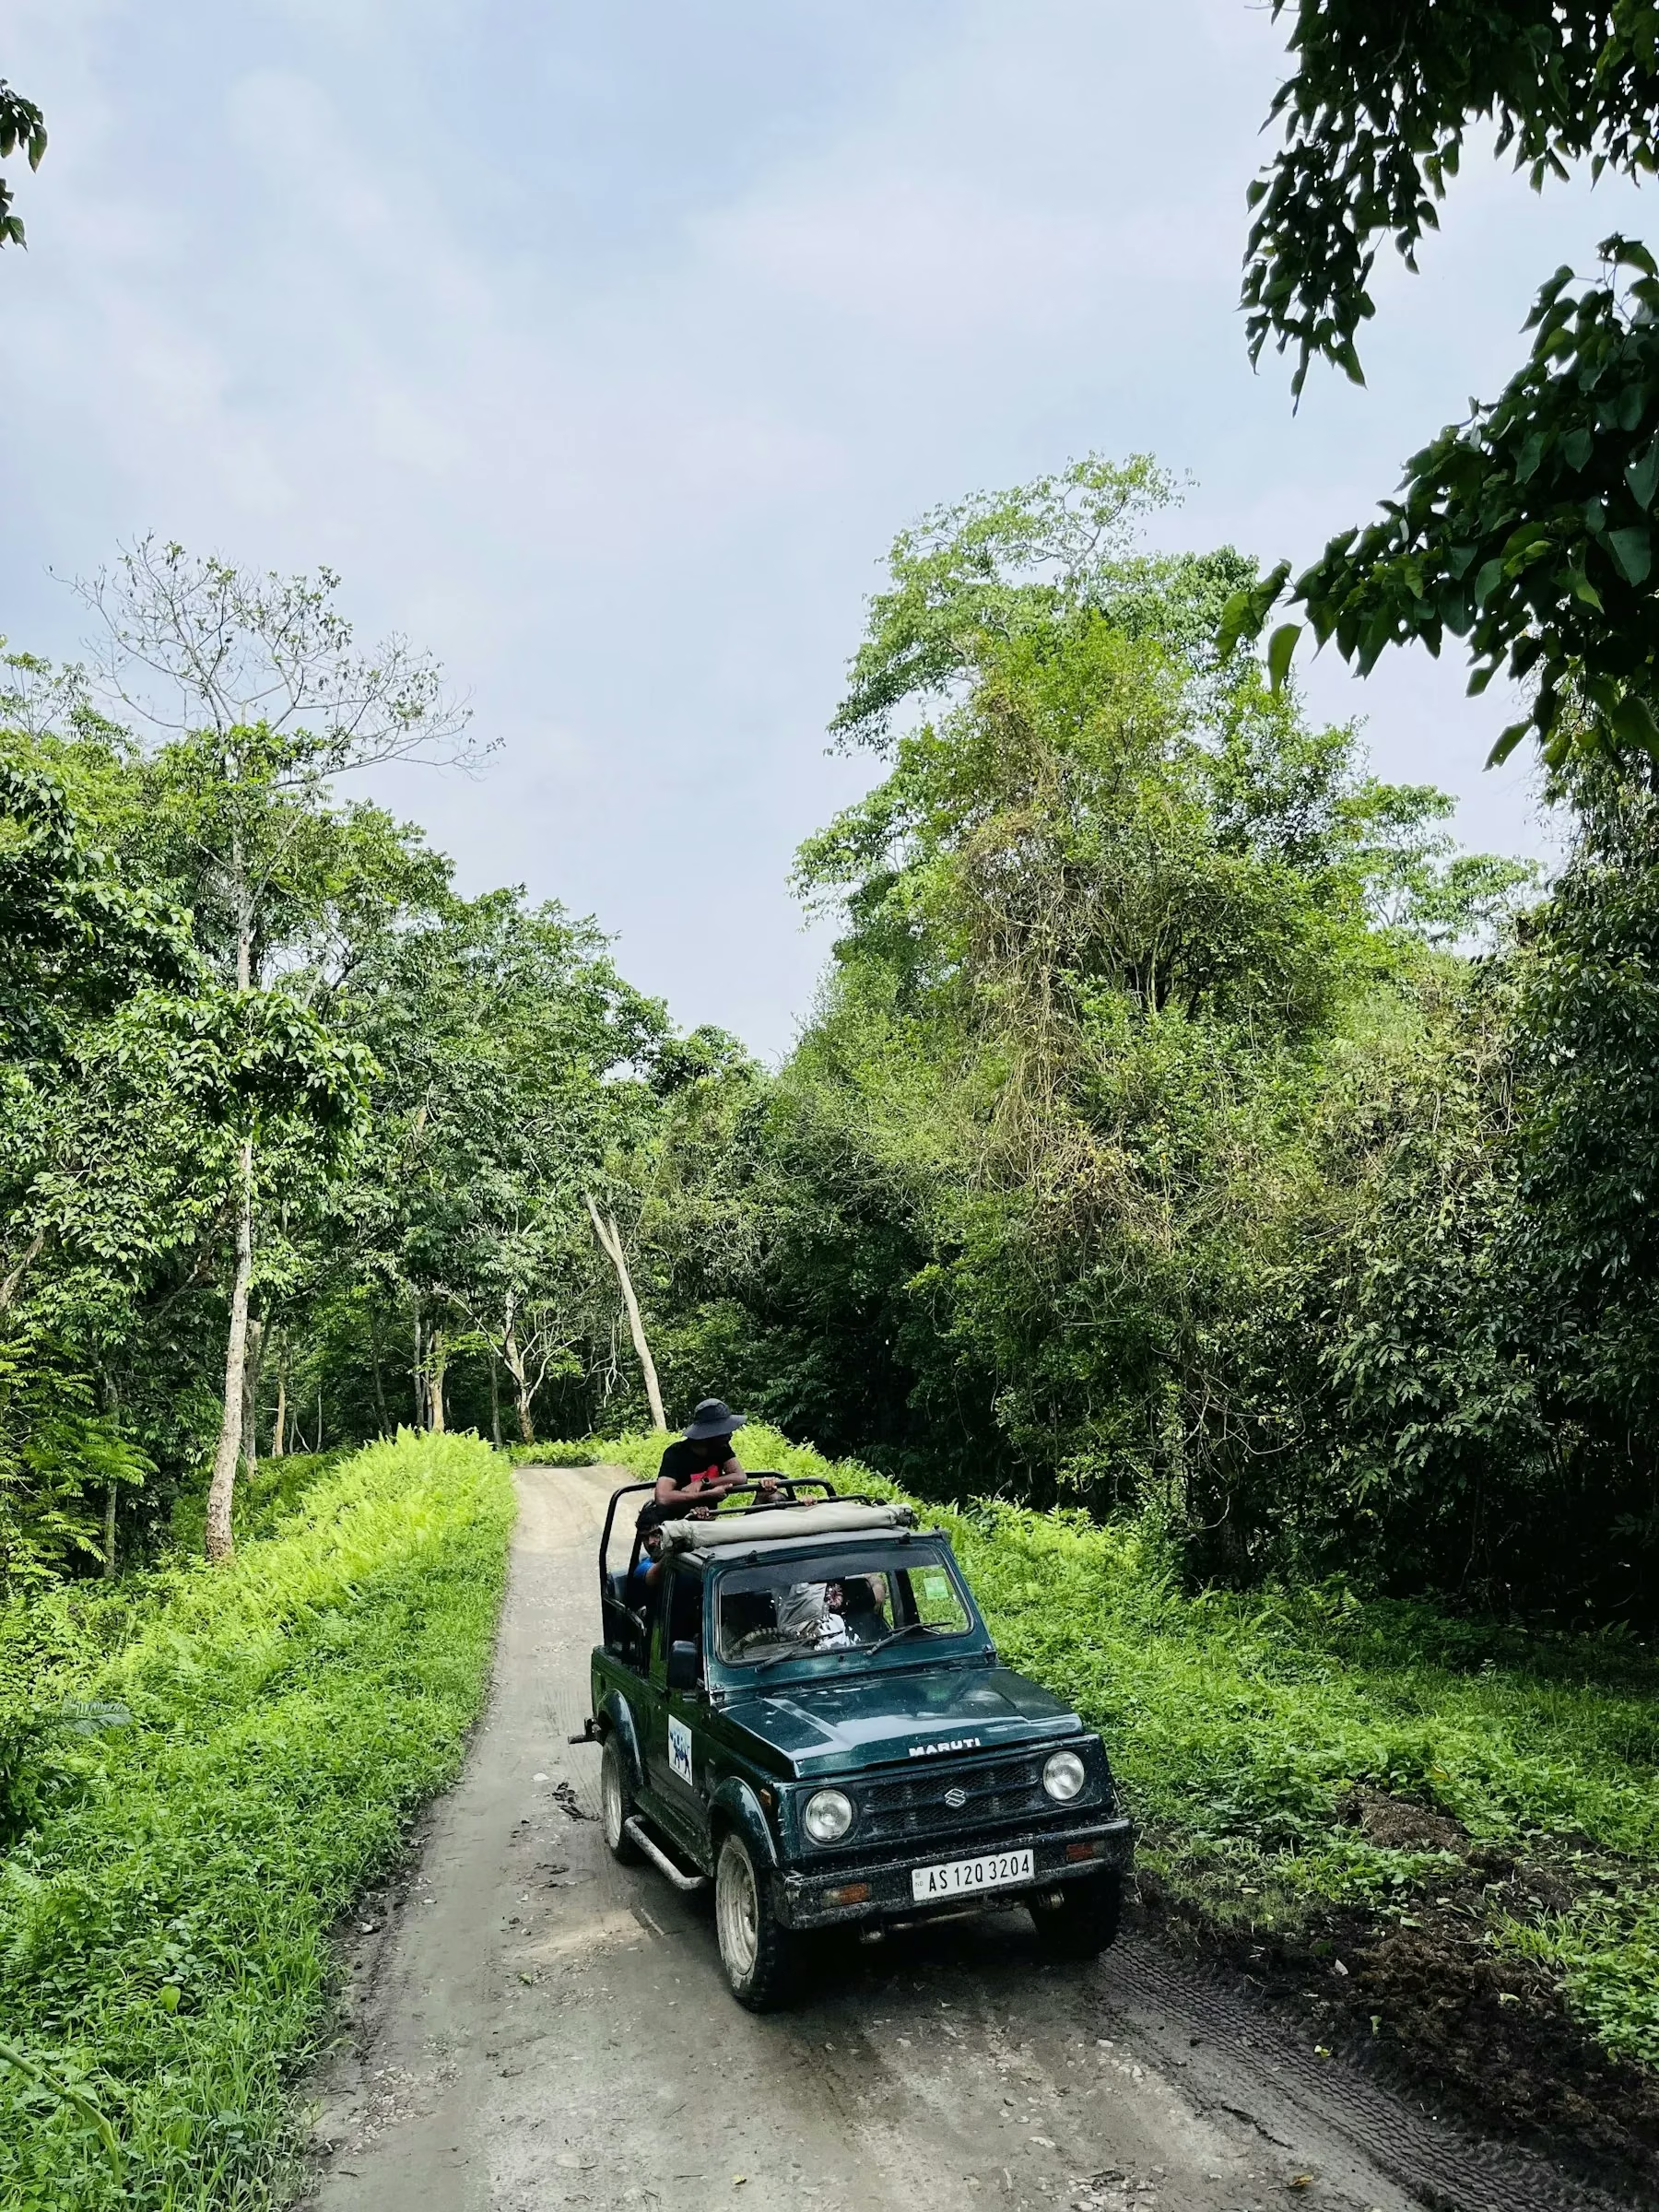
Every figure quoted about Rajaji Tiger Reserve, from the number of tigers to the number of elephants, is the end product of a method: someone walked a transect, set a camera trap, typed coordinates into a database, or fitted a statistical model to photographs of stripe patterns. This article explains those methods using the reserve's own documented research, with dates attached to every study, so that a reader can tell a survey result from a current population total. It publishes no population count of its own, and it deliberately labels every number with the exercise and the year that produced it.
Official sources used, all checked on 20 October 2026: the NTCA and Wildlife Institute of India report Status of tigers, co-predators and prey in India, 2022, edited by Qamar Qureshi, Yadvendradev V. Jhala, Satya P. Yadav and Amit Mallick and published in 2023, which contains the Rajaji section of the 2022 tiger estimation; the Wildlife Institute of India Annual Report 2023-24, which logs completed and ongoing projects with their dates; the Rajaji Annual Plan of Operation sanction order for 2022-23 on the NTCA documents page; and the reserve's own Chilla zone page for visitor-facing context.
What monitoring actually means at a tiger reserve
Monitoring is not one count, it is a stack of repeatable measurements. A reserve needs to know where tigers are, roughly how many there are, whether the number is stable, what the prey base looks like, where elephants move, and which habitats are degrading. Each of those questions has its own instrument. Camera traps answer the identity question because a tiger's stripe pattern is unique, the way a fingerprint is unique. Foot surveys answer the sign and prey question because pugmarks, scrapes and dung tell trained surveyors where animals were recently. Vegetation plots and dung counts answer the habitat and grazing question. Remote sensing answers the landscape question. None of the instruments gives an answer on its own, and the published result is what the combination supports.
For a visitor, the point of understanding the stack is practical. When a guide says a tiger was camera-trapped near a track last season, that is a record with a date. When a report gives a density, that is a model output for a sampled area in a sampled year. And when anyone online quotes a single tiger number for Rajaji without a method and a date behind it, the method and the date are exactly what is missing.
The three-phase method behind the 2022 tiger estimate
The 2022 report describes the national method in three phases, and the same method produced the Rajaji figures. Phase I is a foot survey carried out at the resolution of a forest beat, averaging about 15 square kilometres, in which field teams record carnivore signs for occupancy modelling, walk line transects to measure ungulate abundance, lay habitat plots to record plant species and human impact, and count ungulate dung; the data is entered into the M-STrIPES software system. Phase II adds remotely sensed covariates, such as habitat characteristics and human footprint layers, so that models can relate animal presence to measurable landscape variables. Phase III is the camera trap phase, with one double-sided camera location deployed per 2 square kilometres of sampled tiger habitat.
Behind those phases sit four pieces of software and analysis that matter for accuracy. Camera trap images are organised and geo-tagged with CaTRAT, a tool developed at the Wildlife Institute of India with IIIT Delhi, and sorted by species with an artificial intelligence classifier. Individual tigers are then identified with the ExtractCompare pattern-recognition software, which compares digitised coat patterns against a national database so that the same animal photographed at two stations is counted once. Abundance is estimated with likelihood-based spatially explicit capture-recapture models run in R, using tiger sign encounter rates, prey or dung densities and human footprint variables as covariates. Where genetic confirmation is needed, DNA is extracted from scats, species is confirmed with a species-specific marker, and a panel of eleven microsatellites is used to count minimum individuals, following Kolipakam and colleagues in 2019.
For scale, the 2022 cycle covered a foot survey of 6,41,449 kilometres, 3,24,003 habitat plots, and camera traps at 32,803 locations that produced 4,70,81,881 photographs, of which 97,399 were of tigers, over a total effort of 6,41,102 man-days. Tigers were found occupying 1,03,408 square kilometres of forest, and the report gives a national minimum estimate of 3,167 photo-captured individuals against a model-based national estimate of 3,682 with a standard error of 243. That gap between the minimum and the model is the honest part of the method, and it is the same gap you will see at reserve level.
What the 2022 exercise reported for Rajaji specifically
The Rajaji section of the report, written under the Shivalik hills and Gangetic plains landscape, gives the reserve's own sampling detail. A total of 1,106 tiger images were obtained from the reserve, from which 54 individual tigers were identified. In the eastern part of the reserve, 1,091 images yielded 51 identified individuals, and tiger density there was estimated at 8.15 tigers per 100 square kilometres with a standard error of 1.25. That estimate rests on a model space of 780 square kilometres, sampled with 246 camera points and 17,188 trap nights, using a model fitted separately by sex. The detection-corrected sex ratio in eastern Rajaji was reported as two females per male, and five young tigers were photo-captured.
Two further findings belong with those numbers. In the western part of the reserve, three tigers reintroduced in 2020 were photo-captured during the exercise, and the report separately notes that a tiger previously photo-captured in Rajaji was reported from Simbalbara National Park in Himachal Pradesh in 2023, which is a dispersal record rather than a resident count. At state level, the same report's table gives Uttarakhand's series of model estimates as 178 in 2006, 227 in 2010, 340 in 2014, 442 in 2018, and 560 with a standard error of 24 in 2022. Each of those is a model output for its cycle, and the report warns that state estimates do not add up to landscape estimates because common tigers, tigers outside protected areas and model range limits all intervene.
Why none of that is today's tiger count
Three cautions follow directly from the report's own framing. First, every estimate carries a standard error, and the report instructs that the lower limit of an estimate should be truncated at the minimum number of photo-captured tigers, which means the defensible floor of a model figure is the number of animals actually photographed. Second, the sampling was laid out in 2022, so the density belongs to that season's effort, and animals born, died or dispersed since then are outside it. Third, the western part of Rajaji was still recovering a reintroduced population during that cycle, which the NTCA annual report for 2022-23 also reflects when it records the observation that the western zone needs further augmentation of tiger population. So the accurate sentence is that the 2022 cycle photographed 51 individuals in eastern Rajaji and estimated a density there, not that Rajaji currently holds some fixed number of tigers. Anyone quoting a current total is going beyond what these documents support.
How elephants are studied: a methods trial dated 2023 to 2024
The WII Annual Report 2023-24 logs a project funded by the Uttarakhand Forest Department and titled Evaluation of Efficacy of Various Population Estimation Methods for Elephants to Develop Population Monitoring Protocol, with the stated objective of comparing population estimation methods so that a monitoring protocol can be chosen. The fieldwork it reports is worth reading as a method menu. Line-transect distance sampling used 41 transects of 1 to 2 kilometres, each walked seven times in the western part of Rajaji National Park. Camera-trap distance sampling placed a single camera trap at the centre of a 2 square kilometre grid, covering 210 locations between 1 February 2024 and 31 March 2024. Dung density estimation first measured decay rates and then recorded dung pile density along the transects. Linear spatially explicit capture-recapture surveyed about 370 kilometres of road with seven repeats between 1 and 15 December 2023, recording 159 direct elephant sightings. Grid-based spatially explicit capture-recapture deployed pairs of camera traps at 262 locations in 2 square kilometre grids across western Rajaji during February and March 2024, generating 11,23,705 photographs of which about 9,500 were of elephants.
The report is explicit about what those datasets are for: the analyses are underway, and the results will be used for comparative analysis of the pros and cons of different methods and to recommend a future monitoring protocol. So this is a study of how to count elephants, not an announcement of how many elephants there are. For a visitor, the same document explains why elephant sightings cluster near water and along certain tracks in the western ranges, because those are the habitats the survey designs were built around.
Other dated research running at Rajaji
The same annual report records three more projects with dates that a reader can check. A study of the ecological impacts of major invasive alien plants on native flora in Rajaji, funded by the science and engineering research board, ran from July 2020 to November 2023; it laid 127 quadrats of 10 by 10 metres during 2021 and 2022 across different forest ranges in western Rajaji, and recorded Lantana camara at 5,268 stems per hectare in its sampled plots, recommending a reserve-specific invasive species management plan and enrichment of invaded areas with native leguminous plants. A metapopulation project on tigers across the Terai arc landscape, running from December 2014 to December 2023, reported 722 field-collected carnivore scat samples from Rajaji that identified 398 leopards and 242 tiger-positive samples, with thirteen microsatellites generated for the leopards. And a study of the proposed four-lane Haridwar bypass road Package 2, funded by the National Highways Authority of India and run from April 2023 to March 2024, used trail-based sign surveys and camera trapping from May 2023 to assess wildlife use of the proposed tunnel alignment, because that alignment crosses the reserve's landscape.
One more dated example shows how monitoring is taught. The 44th post-graduate diploma course in advanced wildlife management at WII, which ran from 15 September 2023 to 15 July 2024, included a techniques tour at Rajaji Tiger Reserve from 19 to 30 December 2023, so the reserve doubles as a training ground for the next generation of wildlife managers.
How monitoring appears in management documents
Monitoring also shows up as budget lines. The annexure to the Rajaji Annual Plan of Operation sanction order dated 15 December 2022 lists work items that include camera trap monitoring of tiger movement, monitoring of tigers by daily wagers, daily wagers for monitoring in human-wildlife conflict areas, monitoring equipment, and a line for the 2022 tiger census with smartphones provided for M-STrIPES data entry. Those lines tell a reader that the state's own management budget pays for the same kind of data collection the national reports then use. They are work items in a sanction document for that financial year, not proof of any current staffing level or of any particular number of cameras now in the field.
What this changes about your safari
Nothing about your permit, but everything about how you read what you see. A single drive produces a handful of observations; the reserve's scientific picture is built from thousands of camera-trap nights, transects and samples, produced on a cycle and published with delays. If you want to contribute to the observational side rather than the model side, carry the habit of recording what you saw and where, without disturbing anything. Our wildlife field notes guide covers how to keep a usable sighting record, our tracks and signs guide covers what the forest shows between sightings, and our photography guide covers photographing animals in a way that does not interfere with them. For habitat context behind all of this, our habitats and flora guide and our wildlife calendar cover what lives where and when.
One last discipline. When you see a tiger number attached to Rajaji online, ask three questions: which exercise produced it, what year the fieldwork ran, and whether the figure is a minimum count of photographed individuals or a model estimate with a standard error. If the answer to any of those is missing, the number is being used as decoration rather than as information.
Rajaji wildlife research and monitoring questions answered
How many tigers does the 2022 report say Rajaji has?
It does not publish a single current tiger count for Rajaji, and this article does not give one. The report that covers the 2022 exercise publishes sampling results for the reserve: 1,106 tiger images yielding 54 identified individuals overall, with 51 identified individuals and a density estimate of 8.15 (SE 1.25) tigers per 100 km2 in the eastern part of the reserve, on a model space of 780 km2 sampled with 246 camera points and 17,188 trap nights. Those are results of one dated survey cycle, not a headcount of today.
What methods does the national tiger estimation use?
The 2022 report describes three phases. Phase I is a foot survey at the resolution of a forest beat, averaging about 15 km2, recording carnivore signs, ungulate abundance from line transects, habitat plots and ungulate dung, entered into M-STrIPES software. Phase II adds remotely sensed covariates. Phase III places camera traps at a density of one double-sided location per 2 km2, processes images with the CaTRAT tool built at the Wildlife Institute of India with IIIT Delhi using an AI segregation step, identifies individual tigers with the ExtractCompare pattern-recognition software, and estimates abundance with likelihood-based spatially explicit capture-recapture models in R, with genetic confirmation of scat samples using species-specific markers and a panel of eleven microsatellites.
Is the elephant work at Rajaji a finished census?
No. The WII Annual Report 2023-24 describes an ongoing methods study funded by the Uttarakhand Forest Department, titled Evaluation of Efficacy of Various Population Estimation Methods for Elephants to Develop Population Monitoring Protocol. Its fieldwork compared line-transect distance sampling on 41 transects walked seven times, camera-trap distance sampling at 210 grid centres, dung density estimation, linear SECR over about 370 km of road surveyed in December 2023, and grid-based SECR with paired camera traps at 262 locations between February and March 2024. The report states the analyses are underway and their results will inform a future monitoring protocol, so it publishes method trials rather than a current elephant total for the reserve.
What other research at Rajaji is documented, and when?
Three dated examples appear in the WII Annual Report 2023-24. An invasive alien plants study funded by the science and engineering research board ran from July 2020 to November 2023, using 127 quadrats of 10 by 10 metres laid in 2021 and 2022 across ranges in western Rajaji. A Terai Arc tiger metapopulation project that ran from December 2014 to December 2023 reported 722 field-collected carnivore scat samples from Rajaji that identified 398 leopards and 242 tiger-positive samples. A road impact study for the proposed Haridwar bypass tunnel, run from April 2023 to March 2024, used trail-based sign surveys and camera trapping from May 2023. Each is tied to its own dates and sampling design.
Why do visitors see a number like 8.15 and think it is the number of tigers?
Because a density estimate sounds like a headcount. It is not. The 8.15 figure is tigers per 100 km2 estimated for the sampled eastern part of Rajaji in the 2022 cycle, with a standard error attached, and the report cautions that the lower limit of such estimates should be truncated at the minimum number of photo-captured tigers, and that state estimates do not add up to landscape estimates because tigers move across boundaries. Your own safari sighting is an observation, the camera-trap photo is a record, and the model estimate is a statistical result. All three are real, and none of them is a promise about what you will see on a drive.